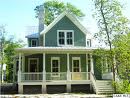
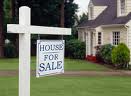
Fredericksburg Area Real Estate Statistics for October 2013

Avery Hess Fredericksburg bridge logoThe VOLUME of Real Estate Sales in the Fredericksburg Area of Virginia was almost 10% more in October 2013 than October 2012. Month over Month October followed the norm with volume dropping as we head into the Holiday and Winter months.  


Average sales PRICE in October 2013($267,162) was 13.18% higher than 2012 and more importantly the highest October average sales price since 2007 when October’s average price was $326,920.00.  It is interesting to note that it is typical for the Average and Median sales prices to drop in October to the rate of around April/May.  

With prices continuing to rise, interest rates moving up a bit over the past few months, and the increased cost of home building, home affordability is weakening.  According to the National Association of Realtors the percentage of homes that were affordable to median income families (defined as income of $64,400) has dropped by almost 5%, the highest drop since 2004. 

As a Realtor I am seeing a drop in the number of distressed, foreclosed and short sale homes in the Fredericksburg area.  This is good for home owners whose improved financial circumstances and increased home values have meant they could sell their homes finally without negative impact on their credit. But it has eliminated some of the lower priced homes that were affordable to a portion of the population such as first time home buyers. 

I am also seeing an increase in the number of NEW homes being built.  This is helping to drive prices higher as demand for homes is slowly increasing.  This of course is also contributing to the housing affordability index decline.  If you are waiting to buy because you think prices are still dropping, think again.   Plus with increased consumer confidence and a steady, positive job market going into 2014, the experts  forecast is that prices will continue to climb or at least stay steady.   Don’t wait to buy.  Between now and the second quarter of 2014, the best deals will be available.  How bout a new home for Christmas and the new year.  


Real Estate Sales Statistics
Latest Month 2013 to same month 2012 Fredericksburg Area, Virginia (Fred.city;Stafford; Spotsy;King George;Caroline)
Oct. 2013 Oct 2012 % Change $ change
Total Sold Dollar Volume $86,026,324 $78,368,634 9.77% $7,657,690
Avg. Sold Price $267,162 $236,050 13.18% $31,112
Median Sold Price $239,950 $223,050 7.58% $16,900
Units Sold 322 332 -3.01% -10
Avg. DOM 67 63 6.35% 4
Avg. Sold to Avg. List Ratio 95.20% 93.80%    
Active Listings 1821 1442 26.28% 379
New Listings this month 646 559 15.56% 87
Marked Contract this month 399 450 -11.33% -51


For a professional opinion on your situation in Real Estate today, email me or send me a note on Facebook. 

Kathie Abercrombie
Realtor
Avery Hess Realtors, Inc.
774 Warrenton Rd.
Fredericksburg, VA.  22406
Office: 540-373-9300

 kathieabercrombie@mris.com

Website:

kathieabercrombie.averyhess.com


Want to see what that house is listed for?

“Real Estate. Real Time. Real Simple”
Text “4kathie” to 87778   OR  
 visit my website to Download my REAL ESTATE SEARCH APP to your Smartphone

EHO logo


May 2013 Real Estate Statistics for Spotsylvania County Virginia

Front door pic 1May 2013 sales of 41,967,699 was the highest May Real Estate volume in Spotsylvania County, Virginia since 2007 and up 22% over last year.  May saw the most new listings posted in Spotsylvania County since June 2008, up 31% over last May.  The average and median sales prices continued to climb with May posting gains of 7.82% and 21.24% respectively.  This brought the average sales price to $246,869  and the median price to $224,900. 


Consumer confidence, jobless rates and Home Builder production are all improving.  According to the National Assoc. of Home Builders, the Wells Fargo Housing Market Index rose 8 points to 52, the first time this index has been over 50 since April 2006 and the largest jump of this index since August and September of 2002.  This index measures current sales conditions, expectations for future sales and traffic of prospective buyers. 

Real Estate Sales Statistics
Latest Month 2013 to same month 2012 Spotsylvania County, Virginia
MAY 2013 MAY 2012 % Change # change
Total Sold Dollar Volume $41,967,699 $34,344,741 22.20% $7,622,958
Avg. Sold Price $246,869 $228,965 7.82% $17,904
Median Sold Price $224,900 $185,500 21.24% $39,400
Units Sold 170 150 13.33% 20
Avg. DOM 57 69 -17.39% -12
Avg. Sold to Avg. List Ratio 95.70% 92.80%    
Active Listings 555 546 1.65% 9
New Listings this month 308 235 31.06% 73
Marked Contract this month 190 197 -3.55% -7


While speculation is uncertain (are we recovering nicely or are we headed for another bubble) the Feds are opting for the conservative side of lets not go too fast and have been raising interest rates over the past month or so.  Lenders are advising us to let people interested in buying know they need to act now to get the best deals and in some cases to qualify at all.   On the other hand home owners who have been waiting to sell are finding prices climbing to where they can take advantage of still low inventories and try to sell their homes.  So it is both a buyers and a sellers’ market right now.   Will prices go up higher over the next year or so?  Maybe but that house you want to buy after you sell yours will also be higher and interest rates will no doubt be higher also.  That place at the beach you’ve been drooling over may just go out of reach over the next two years. 

Just food for thought! 


For expert advice on today’s Real Estate Market and what it means for your own situation, contact:

Kathie Abercrombie, Realtor

Avery Hess Realtors

kathieabercrombie@mris.com

kathieabercrombie.averyhess.com

kathiesblog.wordpress.com

Real Estate. Real Time. Real Simple. Text “4kathie” to 87778 or visit my website to Download my Real Estate Search App to your Smartphone

EHO logo

Real Estate Statistics and News Year to Date April 2013 in Fredericksburg, Virginia

Home pic 2The first Quarter 2013 proved the best Real Estate Market since 2007. 

Volumn rose 19.47% over last year,

Avg. Sales price was up 12.90% or $27,512 over 2012 and the

Median Sales price was up 12.77% or $24,900. 

It took an average of 65 days to sell the 857 homes that sold in the First Quarter of 2013 in Fredericksburg. 


April saw volumn up 10.15%,

Average sales price up 3.48% and

Median sales price up 5.45%. 

119 or .31% of the 380 purchasers transactions in April used Conventional financing. 

The second highest form of purchasing was VA at 103 or .27% of all sales. 

FHA loans have dropped to third place in popularity with 76 home purchasers using FHA. 

104 or .27% of the 380 homes that sold in April took less than 10 days to receive a ratified contract. 


The best news for April is that new listings were up 26.62% over last year.  Consumer confidence has climbed to the highest level in five years. Strong demand but limited supply have driven the sales pace to a frenzy nearing that of 2005 and 2006.  Price increases have been fueled by this factor as well as new home builds on the rise and the reduction in distressed homes for sale. With prices starting to go up and interest rates starting to climb the current pool of qualified buyers, especially first timers may start to decline until salaries and healthy job markets catch up. 


To find out if you qualify to purchase a home OR to find out if you can add your home to the needed inventory of available homes buyers are looking for please email me now.  The best window of opportunity to purchase a home is NOW and in todays market the best time to sell a home is also NOW.


1st Quarter 2013 to 1st Quarter 2012 Fredericksburg Area, Virginia (Fred.city;Stafford; Spotsy;King George;Caroline)
1st Q 2013 1st Q 2012 % Change $ change
Total Sold Dollar Volume $206,182,130 $172,574,177 19.47% $33,607,953
Avg. Sold Price $240,788 $213,277 12.90% $27,512
Median Sold Price $219,900 $195,000 12.77% $24,900
Units Sold 857 809 5.93% 48
Avg. DOM 65 83 -21.29% -18
Avg. Sold to Avg. List Ratio 94.77% 92.57% 2.38%  
Avg. Monthly Active Listings 1300 1360 -4.41% -60
New Listings this quarter 1723 1769 -2.60% -46
Marked Contract this quarter 1375 1450 -5.17% -75


April 2013 to April 2012 Fredericksburg Area, Virginia (Fred.city;Stafford; Spotsy;King George;Caroline)
APR 2013 APR 2012 % Change $ change
Total Sold Dollar Volume $95,119,573 $86,353,622 10.15% $8,765,951
Avg. Sold Price $250,315 $241,887 3.48% $8,428
Median Sold Price $232,000 $220,000 5.45% $12,000
Units Sold 380 357 6.44% 23
Avg. DOM 67 82 -18.29% -15
Avg. Sold to Avg. List Ratio 95.50% 94.40%    
Active Listings 1410 1387 1.66% 23
New Listings this month 761 601 26.62% 160
Marked Contract this month 588 518 13.51% 70


Kathie Abercrombie

Avery Hess Realtors

Fredericksburg, VA 

kathieabercrombie.averyhess.com

katheabercrombie@mris.com

To search for homes just like I do directly from the MLS, download my NEW Mobile App.  It’s  REAL ESTATE, REAL SIMPLE IN REAL TIME…

TEXT 4kathie to 87778

EHO logo

April Real Estate Statistics for Stafford County Virginia

Front door pic 1April continued the positive trend for 2013 with an increase in sales volume of 27.39%, an increase in average sold price of 6.03% or $15,896; an increase in median sold price of 6.71% or $16,665; and it took an average of 65 days to sell the 161 homes in April, a drop of 5 days on the market for the sold homes.


Inventories remain low with very little change from last year though it was great to see an increase in new listings for April of 42.61%.  We are slowly seeing more home owners able to sell without taking a loss.  The inventory of distressed properties is decreasing and the number of new construction homes is on the rise. 

We are optimistic that the trend will continue in this positive direction.  Controlled growth is strenghening the health of the Real Estate Market.

Real Estate Sales Statistics
Latest Month 2013 to same month 2012  Stafford County, Virginia
Apr 2013 Apr 2012 % Change # change
Total Sold   Dollar Volume $45,034,943 $35,352,417 27.39% $9,682,526
Avg. Sold   Price $279,720 $263,824 6.03% $15,896
Median Sold   Price $265,115 $248,450 6.71% $16,665
Units Sold 161 134 20.15% 27
Avg. DOM 65 70 -7.14% -5
Avg. Sold to Avg. List Ratio 96.40% 95.70%    
Active   Listings 482 486 -0.82% -4
New Listings 328 230 42.61% 98
Marked   Contract 274 217 26.27% 57


For more information and to discuss your Real Estate needs or dreams, please contact

Kathie Abercrombie

Realtor

Avery Hess Realtors

Fredericksburg, Virginia

kathieabercrombie@gmail.com

kathieabercrombie@averyhess.com

To search for the most up to date Real Estate listings, download my app.  It’s Real Estate, Real Simple in Real Time. Just  text 4kathie to 87778.  Available now on your smart phone or android. 

EHO logo

The Full Monty Revealed at Riverside Dinner Theatre NOW

Full Monty SignRiverside Dinner Theatre shows it all in their latest comedy production of The Full Monty, a limited engagement from now through April 28th, 2013.  Hurry to book your seats.  You won’t want to be left out and not SEE the antics of six average hard working steel workers in Buffalo, New York who bare it all to survive when they lose their jobs.


Hilarious, laugh a minute surprises are exposed in every scene.  You gotta love these guys forUnion meeting their true devotion to family that drives them to utilize their most precious assets to support their families, save their marriages and raise their self esteem.  You will be so taken with the hilarious interactions that when a tender moment comes along with a heartfelt song, you are transported to a new plateau of appreciation for the talent on stage.


Noah and JeanetteOur beloved Director Patrick A’Hearn has gathered a wealth of talent for this production that stretches from the acclaimed Emmy and Golden Globe Award winner Sally Struthers, back for her second appearance on the Riverside stage, to the new talent of David Pope, recruited from the audience of a previous show by Patrick A’Hearn.Jeanette 4


Sally plays the role of Jeanette Burmeister, a saucy cigarette toting broad who accompanies the guys on piano.  David plays Keno played by David Popethe young striptease star, Buddy (Keno) Walsh, who inspires the idea of stripping to make extra money when the out of work guys see their wives reaction to him at Tony Giordano’s Club.


But that’s just the beginning of the talent.  In the men’s category, we are thrilled to see the return of Jerrial Young, Tommy McGuys in uniformNeal, and Devon Clark as three of our six unemployed steel workers.  They are joined by some fabulous talent new to Riverside; Jeremiah Zinger, Ian Lane and James Bock.  Every one of these guys holds his own on the stage and together they capture the audience heart and soul.


bathroom scene 1You’ll LOVE the bathroom scene where the women reveal their inner feelings.  Continuing to amaze us on the Riverside stage is Vilma Gil, Carol Hagy, Kimberly Fox Knight and Kylie Clark.  New talent joining our familiar ladies are Emily Powers, Kate Salsbury and Brianne Boyd.Two Girls in the mens bathroom


Close Call 1

Close Call 4Close Call 5

CLOSE CALL


Complimenting Patrick we welcome back the creative, award winning Choreographer Christopher Noffke and the expert musical direction of Jason Michael’s who also plays Reg Willoughby, another unemployed mill worker.


Technical challenges abound for the expanded staff of Stage, Lighting, and Audio  Technicians, Live Musicians, Wardrobe and Costume masters,Funeral with backs Scenic Artists and Set Designers.  Pieces change constantly with passing spaces and set coordinates frequently less than an inch.  At any one time, a coffin, a car, a tanning bed, a piano or a bathroom complete with urinals, sinks and stalls all share space with the buildings, actors Dave with Malcolm in carand live band.  Actors model new wardrobe pieces and costumes for five minutes before they peel them off and on to the next scene change where they do it all over again.  They dress for a steel mill, a night club, a funeral, job interviews and of course the piece to resistance; what’s this show called again?!!!  You won’t be bored!


Dave and Georgie 2Is this show too risqué for some?  Probably, but as director Patrick A’Hearn says in the Directors notes, “Ultimately, The Full Monty is a show about family and family values.  It’s about taking chances, and not accepting ‘NO’ for an answer.  It’sJerry and his son about being proud of who you are regardless of how you look or whom you choose to love.  …it’s message is much deeper

Harold and Vicki 2

Malcolm and his mom

than shedding one’s clothes – more about revealing who you are to others and, more importantly, to yourself.  The fear of full disclosure is huge but once it is conquered, the rewards are great and one’s fullest potential can be recognized.”Jerry on knee over Dave on floor


For showtimes, tickets, seating charts, menus, and more see the Riverside website at riversidedt.com or call the box office at 540-370-4300.Special pic with blocked out middle


Written by:

Kathie Abercrombie, Realtor

Avery Hess Realtors

Fredericksburg, VA

kathieabercrombie@mris.com

kathieabercrombie.averyhess.com

kathiesblog.wordpress.com

EHO logo

Fredericksburg Area Virginia Real Estate Statistics for February 2013

steeple reflection in water from spotsylvaniaThe Realtor’s in the Fredericksburg Avery Hess office had the best January and February we have had in over five years.  Statistics just posted this week substantiate this fact.   Combining all the surrounding counties of Fredericksburg, we saw 16.31% increase in sales volume in February.  Home owners and sellers will be happy to see that the average sold price went up 9.15% increase and the median sold price was up 9.15% year over year.   


The area as a whole showed active and new listings both down by about 5%.  Though inventory of active listings went up slightly from January to February, they are still the lowest they have been since before 2005, (the farthest back I could gather statistics from our MLS).  According to the National Association of Realtors, Inventories nationally are the lowest since 1999. 

Average Days on the market are where they were in 2006.  Low inventories are driving buyers to snatch up the properties priced right and in the best condition.  Buyers are coming out in increasing numbers and all signs point to the pool of buyers continuing to increase. 

21% of all means of purchase for the month of February was cash, the third largest means of purchasing the 276 homes sold in February.  For the first time in a long time we are seeing conventional financing take the lead now that FHA has changed their qualifications and requirements.  Here is the breakdown of how homes were purchased in February:

Conventional Loan              79    or    29%

VA  Loan                                67    or     24%

Cash                                        57    or     21%

FHA   Loan                              55    or    20%

Other (VHDA, RD, etc)         17     or      6%

Owner Financing                      1


Real Estate Sales Statistics

Latest Month 2013 to same month 2012

Fredericksburg Area, Virginia (Fred.city;Stafford; Spotsy;King George;Caroline)

FEB 2013

FEB 2012

% Change

$ change

Total Sold Dollar Volume

$66,529,175

$57,197,545

16.31%

$9,331,630

Avg. Sold Price

$241,048

$220,840

9.15%

$20,208

Median Sold Price

$219,900

$205,000

7.27%

$14,900

Units Sold

276

259

6.56%

17

Avg. DOM

67

91

-26.37%

-24

Avg. Sold to Avg. List Ratio

94.20%

91.50%


Active Listings

1287

1354

-4.95%

-67

New Listings this month

522

549

-4.92%

-27

Marked Contract this month

424

461

-8.03%

-37


According to statistics published by Hamilton Ridge Consulting, Inc. Avery Hess Realtor’s took the 1st , 2nd  , 3rd, and 3rd places in percentage growth for sales and listings respectively in the past two months compared to all Real Estate companies in our area.  The Metropolitan Regional Information Systems (MRIS), the Multiple Listing Service for our area just posted the ranks of market share of Listings posted for all Real Estate Companies using their services.  Avery Hess has climbed to the number 10 position.  These stats may not sound like much but it shows that Avery Hess is right up there with the big boys with proven qualifications you can trust.    


For expert advice on today’s Real Estate Market and what it means for your own situation, contact:

Kathie Abercrombie, Realtor

Avery Hess Realtors

540-373-9300

kathieabercrombie@mris.com

kathieabercrombie.averyhess.com

kathiesblog.wordpress.com

EHO logo

January 2013 Real Estate Statistics for Stafford County, Virginia

Stafford Virginia2013 is off to a good start for Real Estate in Stafford County.  An average price increase of 12.83% contributed to the 8.36% increase in sales volume for January while the number of units sold was less by 3.96% or 4 units, year over year.  Median sales price last month was 22.22% up from  last January. 

Also good news for Stafford County, active listings were up by 5.71%.  New listings for the month stayed fairly even to last year with a 1.57% increase.  Listings marked contract in January was up by 15.09% from last year.

As the statistics show, buyers are out there.  It took 65 days on average for the 97 homes that sold to go from listing to closing.  That was 8 days less than January 2012.    Inventories are still low. Active listings in Stafford County were 444 at the close of January 2013.

I am also including in this post, the Stafford County year 2012 totals compared to 2011 for your review.  While inventory dropped by 11.60%, sales volume, average price and median price figures were up.  The average sales price was up by $20,620; median price up $29,000.


January Stats:

Real Estate Sales Statistics

Latest Month 2013 to same month 2012

Stafford County, Virginia

JAN 2013

JAN 2012

% Change

# change

Total Sold Dollar Volume

$26,949,870

$24,871,092

8.36%

$2,078,778

Avg. Sold Price

$277,834

$246,248

12.83%

$31,586

Median Sold Price

$275,000

$225,000

22.22%

$50,000

Units Sold

97

101

-3.96%

-4

Avg. DOM

65

73

-10.96%

-8

Avg. Sold to Avg. List Ratio

94.90%

93.20%


Active Listings

444

420

5.71%

24

New Listings

194

191

1.57%

3

Marked Contract

183

159

15.09%

24


Year 2012 compared to 2011 for Stafford County, Virginia:

2012 Year Totals to 2011 Year totals

Stafford County, Virginia

2012

2011

% Change

$ change

Total Sold Dollar Volume

$445,516,649

$416,755,488

6.90%

$28,761,161

Avg. Sold Price

$270,174

$249,554

8.26%

$20,620

Median Sold Price

$259,000

$230,000

12.61%

$29,000

Units Sold

1,649

1,670

-1.26%

-21

Avg. DOM

59

74

-20.27%

-15

Avg. Sold to Avg. List Ratio

95.60%

93.90%

1.81%


Avg. Monthly Active Listings

483

547

-11.60%

-63

New Listings

2,613

2,382

9.70%

231

Market Contract

2,101

2,139

-1.78%

-38


For more information or to discuss your own Real Estate needs, please contact me:

Kathie Abercrombie

Avery Hess Realtors

kathieabercrombie@mris.com

kathieabercrombie.averyhess.com

kathiesblog.wordpress.com

EHO logo

January 2013 Real Estate Statistics for Spotsylvania County, Virginia

steeple reflection in water from spotsylvaniaThis is BIG news.  Spotsylvania saw incredible increases year over year in January Real Estate sales volume and prices .  37.31% increase in sales volume, 31.76% increase in average sales price and 31.29% increase in median sales price.  Average Days on the Market was also a fabulous 23.08% less than January 2012 or 18 less days.  The increased sales volume has contributed to further reducing the already record low inventory of homes available to sell.  Down 15.82% year over year, with new listings also 14.15% down over last year, low inventory continues to be a significant factor in the come-back of the Real Estate market.

These figures are significant for a couple of reasons.  First, they support the projection that the pool of buyers in growing.  As I mentioned in my blog on the outlook for 2013 last month, there are lots of positive signs and reasons that buyers are on the increase.  Secondly, we saw a lot of buyers waiting till after the elections and after the decisions associated with the fiscal cliff to initiate a home purchase. 

What we are projecting now is more sellers stepping up to take advantage of the increased prices and low inventories of available homes.  In that vein we are also seeing fewer seller concessions in some markets where multiple offers are competing for those “good” listings.  The pendulem is slowly swinging back in the direction of the seller.


Real Estate Sales Statistics

Latest Month 2013 to same month 2012

Spotsylvania County, Virginia

JAN 2013

JAN 2012

% Change

# change

Total Sold Dollar Volume

$22,779,872

$16,590,417

37.31%

$6,189,455

Avg. Sold Price

$230,100

$174,635

31.76%

$55,465

Median Sold Price

$203,500

$155,000

31.29%

$48,500

Units Sold

99

95

4.21%

4

Avg. DOM

60

78

-23.08%

-18

Avg. Sold to Avg. List Ratio

94.70%

91.60%


Active Listings

447

531

-15.82%

-84

New Listings this month

182

212

-14.15%

-30

Marked Contract this month

154

166

-7.23%

-12


If you or anyone you know is considering buying or selling property, please contact me. 


Kathie Abercrombie, Realtor

Avery Hess Realtors

kathieabercrombie@mris.com

kathieabercrombie.averyhess.com

kathiesblog.wordpress.com

EHO logo

LOOKING FORWARD TO THE 2013 HOUSING MARKET

House for salePrices, new home starts and consumer confidence are all on an upward trend.  While the last several years have been in favor of the buyer, that tide may be turning towards the seller or at least a more even market.


THE OUTLOOK FOR THE HOME BUYER

  • The number of home buyers is expected to grow:

Housing moves have been relatively stagnant since the collapse of the Real Estate Market, especially during the economic recession years 2007 – 2009 creating a pent up demand from changing circumstances.

As people who started undergoing foreclosures back in 2007 gain financial strength and pass that seven year mark of borrowing restrictions, they will be ready to move from the rental market back into home ownership.

Many people desiring to buy real estate have been waiting for prices to bottom out before entering the market.  This includes first time home buyers, families moving up, baby boomers reaching that empty nest stage looking to down-size and people re-thinking that vacation property purchase.  Now that prices are consistently rising these consumers will be looking to buy.

A strengthening in employment figures points to more employed workers who will have the means to purchase Real Estate and the desire with interest rates so low and prices just starting to rise.

  • Mortgage Rates:

The news is that the Central Bank will not raise interest rates until unemployment rates drop below 6.5%.  The Federal Reserve is expected to maintain record low interest rates over the next year with increases of no more than 4% according to expert reports.

While the best available interest rates are at record lows of under 3%, the number of people who actually qualify for these  lowest rates is minimal making an increase to a low of 4 or even 5% fairly inconsequential to most loans.

  • NEW ground rules for Mortgage lenders:

The Consumer Financial Protection Bureau issued new qualified mortgage standards earlier this month that detail criteria lenders must use to determine if a borrower qualifies for a loan.  These criteria include:

  • Mortgages with risky features such as extending beyond 30 years are not allowed.
  • Interest Only payments are not allowed
  • Negative amortization payments where the principle increases are not allowed.
  • Fees and points above 3% of total mortgage are not allowed
  • Debt to income ratio of the buyer can be no greater than 43%

This last criteria directly affects the pool of potential buyers.  Put the above conditions all together and the message to buyers is PREPARE.  Buyers need to start the mortgage lending process probably three months before they even start to seriously look at homes to purchase.  It will be more important than ever to pick a qualified, knowledgeable and experienced mortgage lender before doing anything else.  Buyers should interview several to have confidence and be comfortable with the final choice.

Working with a qualified, knowledgeable and experienced Realtor is also a necessity.  A Realtor will negotiate every step of the home buying process with you and help you weigh all your options starting with providing a list of reputable lenders for you to talk to.

It is also important for you to know the laws have changed regarding Realtor/Client representation.  At the onset of a business relationship between buyer and agent, a document must be signed clarifying and defining the responsibilities and duties of each party.  Realtors are professionals with high standards of conduct they must adhere to.  Their job is to execute a Real Estate contract, often the largest financial commitment and most detailed transaction people experience in their lives. This requires a large investment of time and expertise on the part of the Realtor. Hence, an agreement in writing is certainly appropriate.

Once these steps are completed, Buyers need to be prepared to act quickly as they start house hunting.  Low inventories of available homes and the increased pool of home buyers will create a more competitive environment. Communication with your Realtor is paramount so you know what to expect and what you want to do in each situation to successfully obtain your goals.

THE OUTLOOK FOR SELLERS

This competitive environment of low inventories but increased demand has the potential to push prices higher, creating a more appealing arena for the home seller. More home owners who have been waiting for prices to go up to put their property on the market will find they can do that in 2013.

Two conditions seem critical in my view to maintaining a healthy Real Estate market for the coming years.  One is that home owners do come forward and list their properties for sale and two is that they list those homes at reasonable, realistic prices.  The irresponsible anything goes era of the early 2000’s must not be repeated.

Statistics show the Fredericksburg area in a strong lead position as the nation moves towards a healthy Real Estate recovery over the next several years. But we have to be careful and take responsibility for ethically controlled growth without reckless abandonment of moral principles.

See my latest blog with 2012 statistics for the Fredericksburg area. If you are interested in buying or selling Real Estate or know someone who is, please contact me.

Commentary and Content provided by

Kathie Abercrombie, Realtor

Avery Hess Realtors

Kathieabercrombie.averyhess.com

kathieabercrombie@gmail.com

kathiesblog.wordpress.com

on FB as Kathleen Lamkin Abercrombie

on LinkedIn as Kathie Abercrombie

EHO logo

Fredericksburg Area, Virginia 2012 Year End Real Estate Statistics

William Street2012 was a good year for Real Estate in Fredericksburg.  Below I have provided charts of statistics and commentary for December, the fourth quarter, and the year in total. 


DECEMBER SALES

December saw a decline in overall sales year over year and in units sold.  I speculate that this was due to political events the previous month coupled with some apprehension and concern about the fiscal cliff issues.  The sales that did take place in December took an impressive 16.67% or 14 days less time to close year over year.  It was also good to see more new listings come on the market.


Real Estate Sales Statistics

Latest Month 2012 to same month 2011

Fredericksburg Area, Virginia (Fred.city;Stafford; Spotsy;King George;Caroline)

Dec 2012

Dec 2011

% Change

$ change

Total Sold Dollar Volume

$66,584,414

$71,831,777

-7.31%

-$5,247,363

Avg. Sold Price

$229,601

$227,316

1.01%

$2,285

Median Sold Price

$211,500

$215,000

-1.63%

-$3,500

Units Sold

290

316

-8.23%

-26

Avg. DOM

70

84

-16.67%

-14

Avg. Sold to Avg. List Ratio

94.30%

93.20%


Active Listings

1326

1399

-5.22%

-73

New Listings this month

367

346

6.07%

21

Marked Contract this month

293

309

-5.18%

-16


4TH QUARTER 2012


Looking at the fourth quarter totals a much stronger market emerges.  9.14% increase in total sales volume, almost 5% increase in average sales price and 2.58% increase in median sales price accompany a 22% decrease in the number of days it took to sell the 937 properties sold in the Fredericksburg area during the 4th quarter 2012. 

Even better news was the 10.5% increase in new listings coming on the market this quarter over last year’s 4th quarter. 


4th Quarter 2012 to 4th Quarter 2011

Fredericksburg Area, Virginia (Fred.city;Stafford; Spotsy;King George;Caroline)

4th Q 2012

4th Q 2011

% Change

$ change

Total Sold Dollar Volume

$223,247,802

$204,546,579

9.14%

$18,701,223

Avg. Sold Price

$238,069

$226,830

4.95%

$11,239

Median Sold Price

$214,900

$209,488

2.58%

$5,412

Units Sold

937

903

3.77%

34

Avg. DOM

67

86

-22.09%

-19

Avg. Sold to Avg. List Ratio

94.10%

92.73%

1.47%


Avg. Monthly Active Listings

1384

1486

-6.91%

-103

New Listings this quarter

1337

1210

10.50%

127

Marked Contract this quarter

1098

1126

-2.49%

-28


 2012 COMPARED TO 2011


The Fredericksburg area saw strengthening in the Real Estate market in 2012 equal to or greater than the Nation as a whole.  10% median sales price increase, 7.05% average sales price increase, 6.9% volume increase and 16.28% or 14 day decrease in the number of Days it took to sell the 4178 units that sold in 2012.  You can see the effect of the price increase when you compare the increased sales volume with the units sold and the number of listings that went under contract in 2012.  5 Less units sold while sales volume increased by $64,306,847 and 351 less units were marked contract.

Inventory remains a key factor.  2012 saw an average of 283 less listings available for sale each month than 2011.  Available inventory is the lowest it has been since 2005  This factor will highly influence the housing recovery during 2013. 

The following figures include sales that were posted to the MLS system after each month was already published and therefore are greater than the sum of my monthly reports. 


2012 Year Totals to   2011 Year totals

Fredericksburg Area, Virginia   (Fred.city;Stafford; Spotsy;King George;Caroline)

2012

2011

% Change

$ change

Total Sold Dollar   Volume

$996,686,006

$932,379,159

6.90%

$64,306,847

Avg. Sold Price

$238,556

$222,844

7.05%

$15,712

Median Sold Price

$220,000

$200,000

10.00%

$20,000

Units Sold

4,178

4,184

-0.14%

-6

Avg. DOM

72

86

-16.28%

-14

Avg. Sold to Avg. List   Ratio

94.40%

92.50%

2.05%


Avg. Monthly Active   Listings

1,417

1,700

-16.66%

-283

New Listings

6,522

6,333

2.98%

189

Marked Contract

5,127

5,478

-6.41%

-351


The stage is set for 2013 to be an even better year for Real Estate in the Fredericksburg area.  For important information on what Buyers and Sellers can expect over the next year, see my blog “Looking Forward to the 2013 Housing Market” coming soon.

If you are interested in buying or selling Real Estate or know someone who is, please contact me. 


Commentary and Content provided by

Kathie Abercrombie, Realtor

Avery Hess Realtors

Kathieabercrombie.averyhess.com

kathieabercrombie@gmail.com

kathiesblog.wordpress.com

on FB as Kathleen Lamkin Abercrombie

on LinkedIn as Kathie Abercrombie

EHO logo